
Dashboard
All roles have access to the Dashboard.
The Dashboard gives a real-time snapshot of the user’s current activities within the system. Only Sales Reps will see the “My KPIs” section displayed at the top, as other user roles do not have performance tracking. The Dashboard serves as a place where Reps can see their productivity in multiple categories in one organized space.
The Dashboard presents 3 tabs displaying data at the following levels:
- User
- Team
- Company
The User tab displays the following sections:
My KPIs (Sales Reps only)
My KPIs page displays all of your current Key Performance Indicators. It serves as a snapshot of your productivity. The performance view can be toggled to Today or MTD. The default view is Today and includes the following:
- Sales - The total revenue generated from sales
- Gross Profit - The total revenue minus the cost
- Quotes - The total number of quotes provided to customers
- Lines - The total number of product line items sold
- Customers - The total number of unique customers who purchased
- Productive Calls - The total number of calls made exceeding 35 seconds
- Calls - The total number of calls made
- Duration - The total time spent on customer calls, measured in minutes
- Lead Visits - The count of in-person visits to leads
- Customer Visits - The number of in-person visits to existing customers
- GP Margin - The percentage of gross profit relative to total revenue, indicating profitability
- Customers Closed - The number of new customers acquired
The MTD performance view includes all the information contained above as well as:
- Projected monthly values with percentages
- Average value per day
Monthly data calculations are based upon current sales rep performance and monthly goals.
KPI Graph
The KPI Graph shows a visual representation of your performance and can be filtered by:
- KPI Type (dropdown; dynamic list that is based upon KPI configuration for Sales Rep)
- Range (dropdown):
- MTD
- Last Month
- QTD
- Last Quarter
- YTD
- Last Year
- Custom (when chosen, start and end date filters can be selected via More Filters button)
- More Filters (button):
- Hide Non-Business Days (checkbox) - for more information, please refer to Non-Business Days
- Start Date and End Date (filters appear when Custom Range type is chosen in Range dropdown)
Selecting different KPI types in the dropdown will update the graph to show the KPI's values over the chosen time period. Hovering over the graph will display data points with values corresponding to that date.
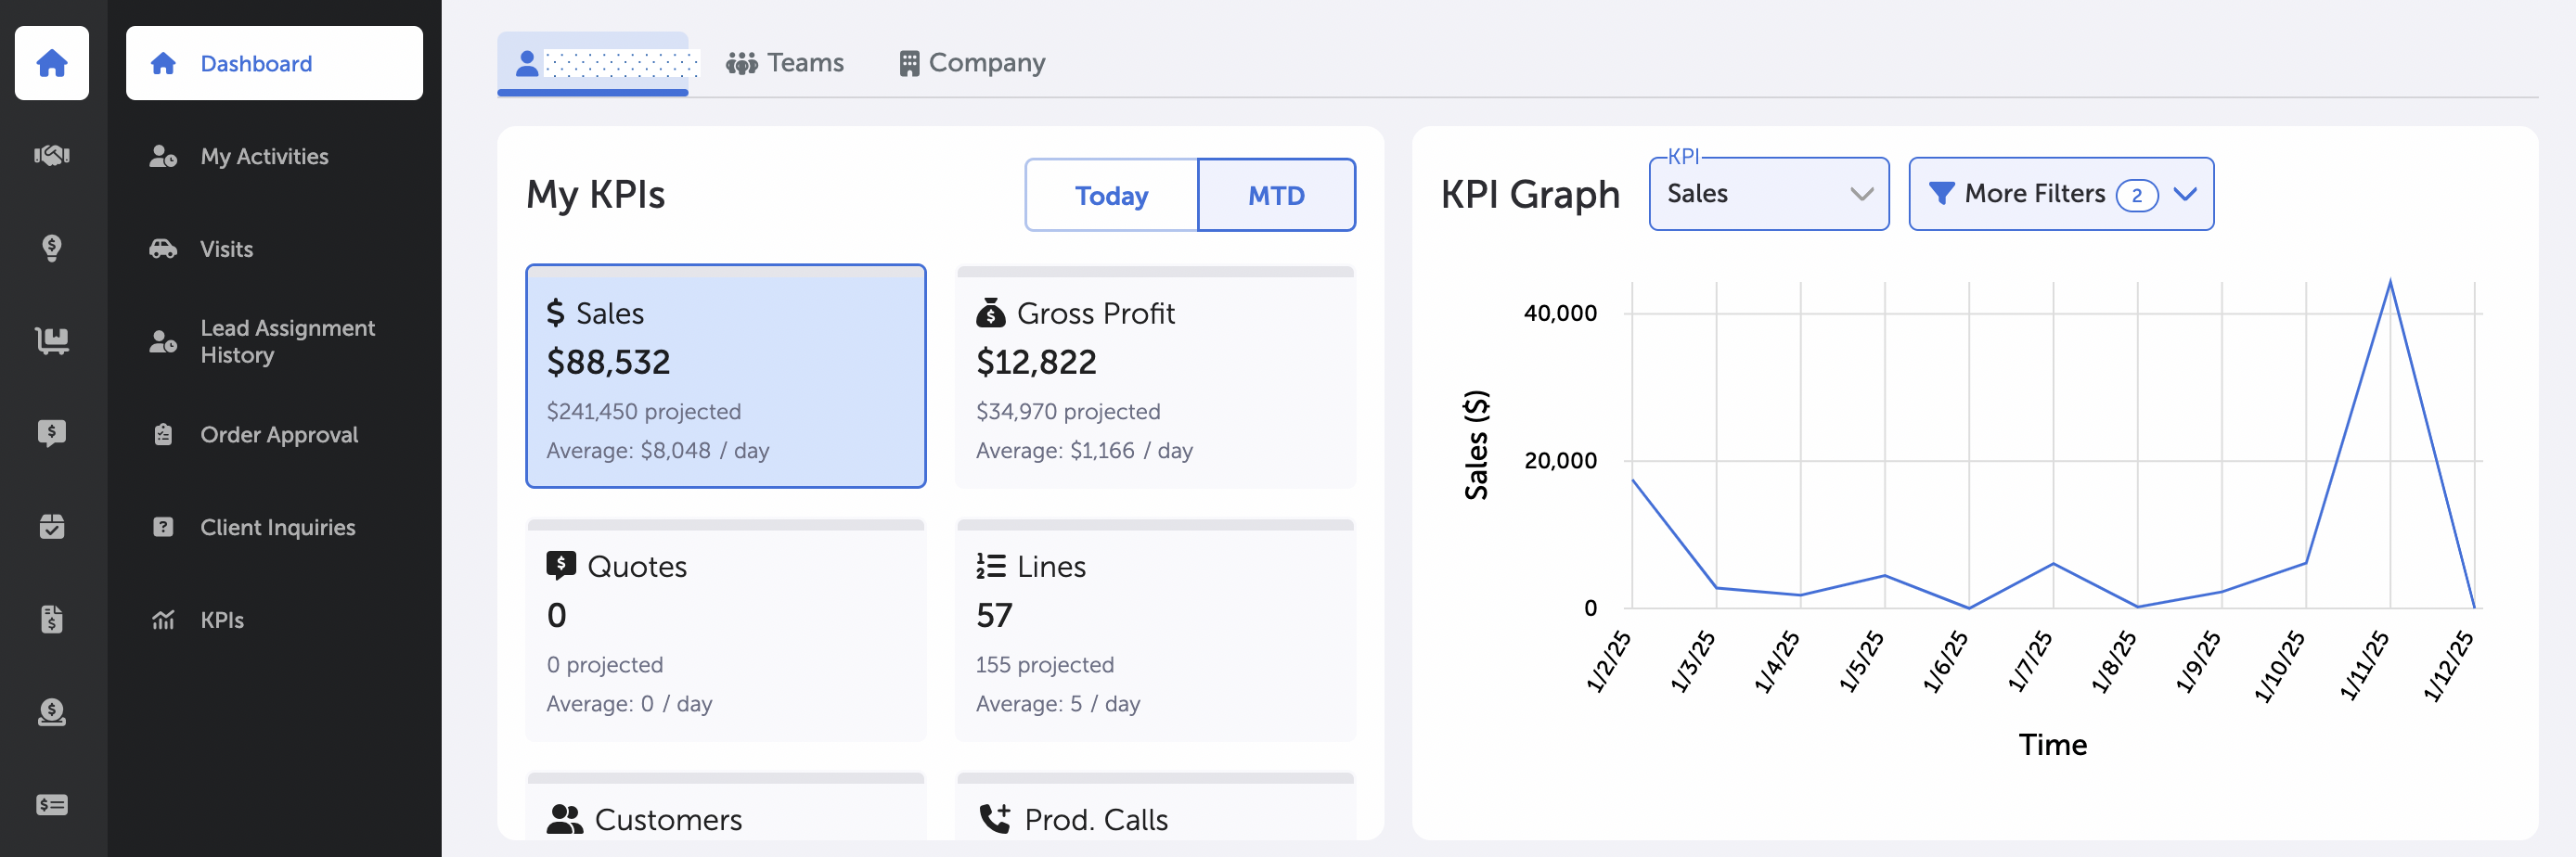
Dashboard - My KPIs & KPI Graph
My Activities(This feature is available to all users.)
This area lists the five most recent activities and includes the following:
- User, date, time
- Client name (hyperlink), address
- Lead/Customer designation
- Phone number
- Subject
- Priority
You can complete activities by selecting the checkmark to the left of the row. To edit or delete an activity, select the Edit dropdown button on the right-hand side.
Selecting the View More button displays the My Activities page with additional activity history.
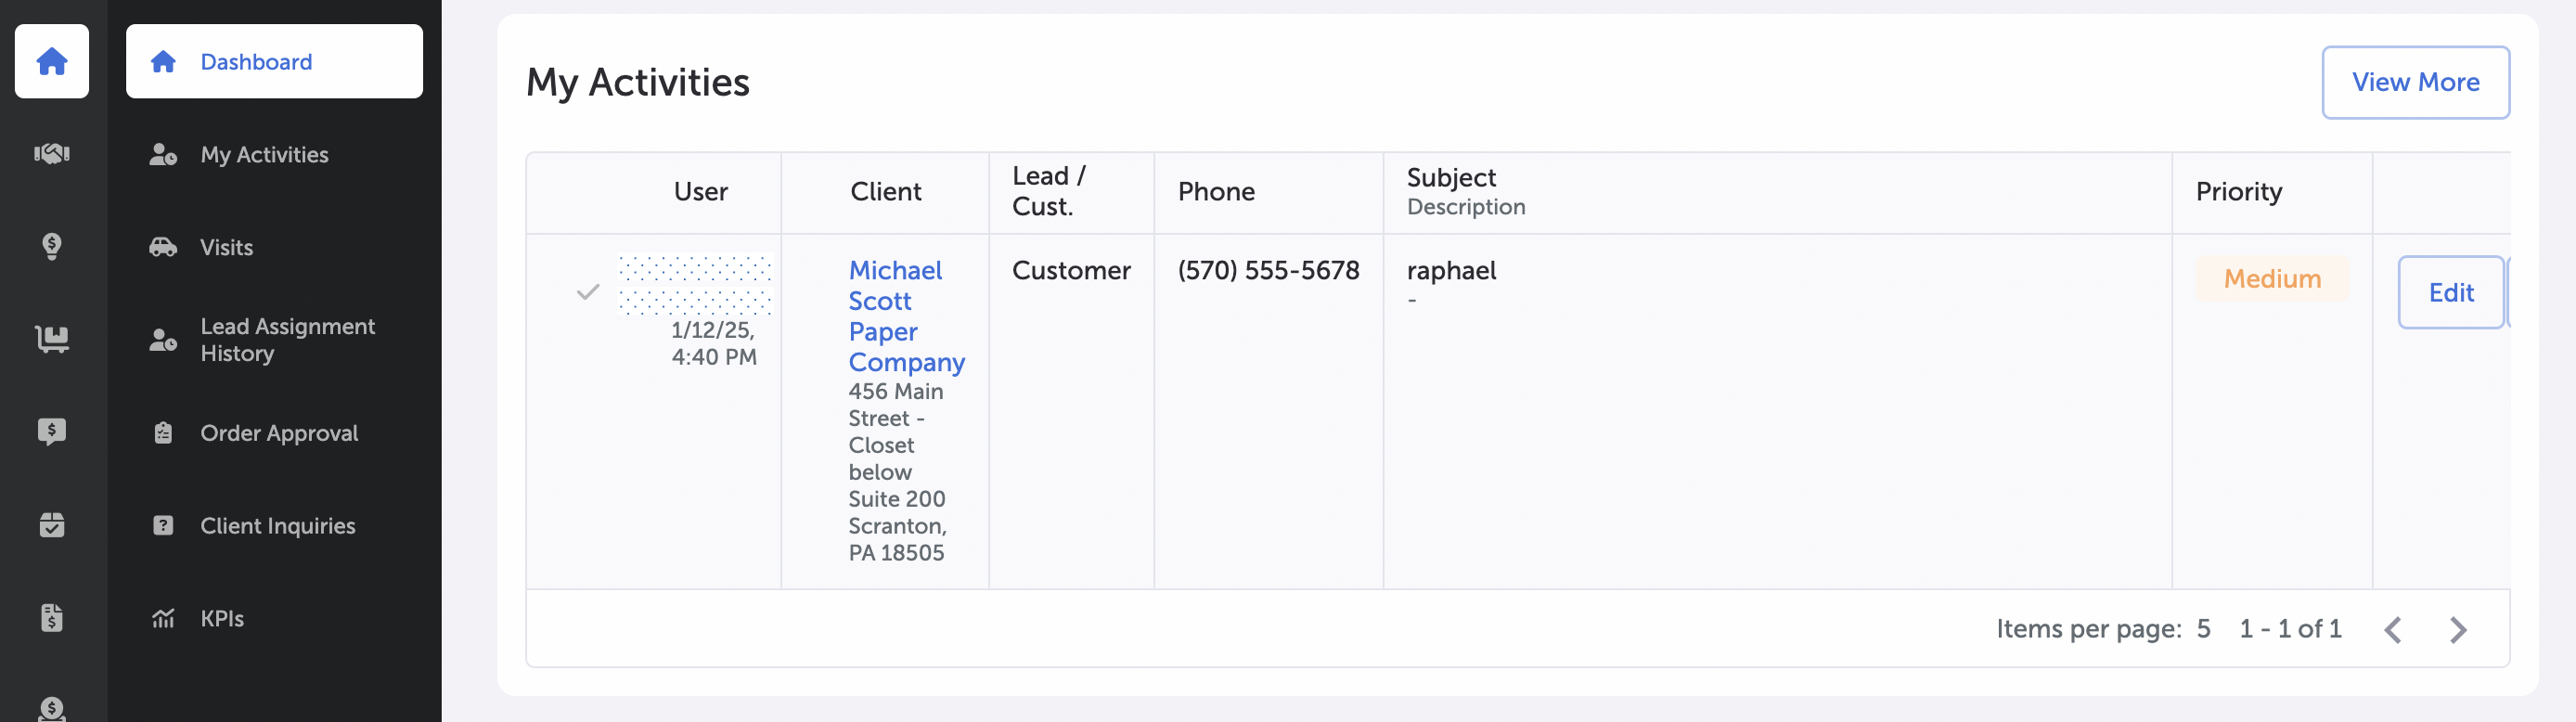
Dashboard - My Activities
At Risk
At Risk clients are customers that are in need of attention based upon sales data. The 5 most recent At Risk clients are displayed with the following information:
- Client (name; hyperlink)
- Address (street #, name, city, zip)
- Phone
Contact Due
Clients with Contact Due are in need of communication based upon sales data. Your 5 priority Contact Due clients are displayed.
Today’s Open Carts (All users)
Today's Open Carts shows pending filled carts in need of review. Your 5 most recent open Carts are displayed with the following:
- Client, Address
- Details, Number of Lines, Last Modified Date/Time
- Total (total dollar amount in cart)
Selecting the View More button displays the Orders page with additional order information.
For additional information, please refer to Orders.
Today’s Orders (All users)
Today's Orders displays your clients' 5 most recent completed Orders and includes:
- Order # (number, status)
- Client (name)
- Total (total dollar amount of order, number of lines)
Selecting the View More button displays the Orders page with additional order information.
For additional information, please refer to Orders.
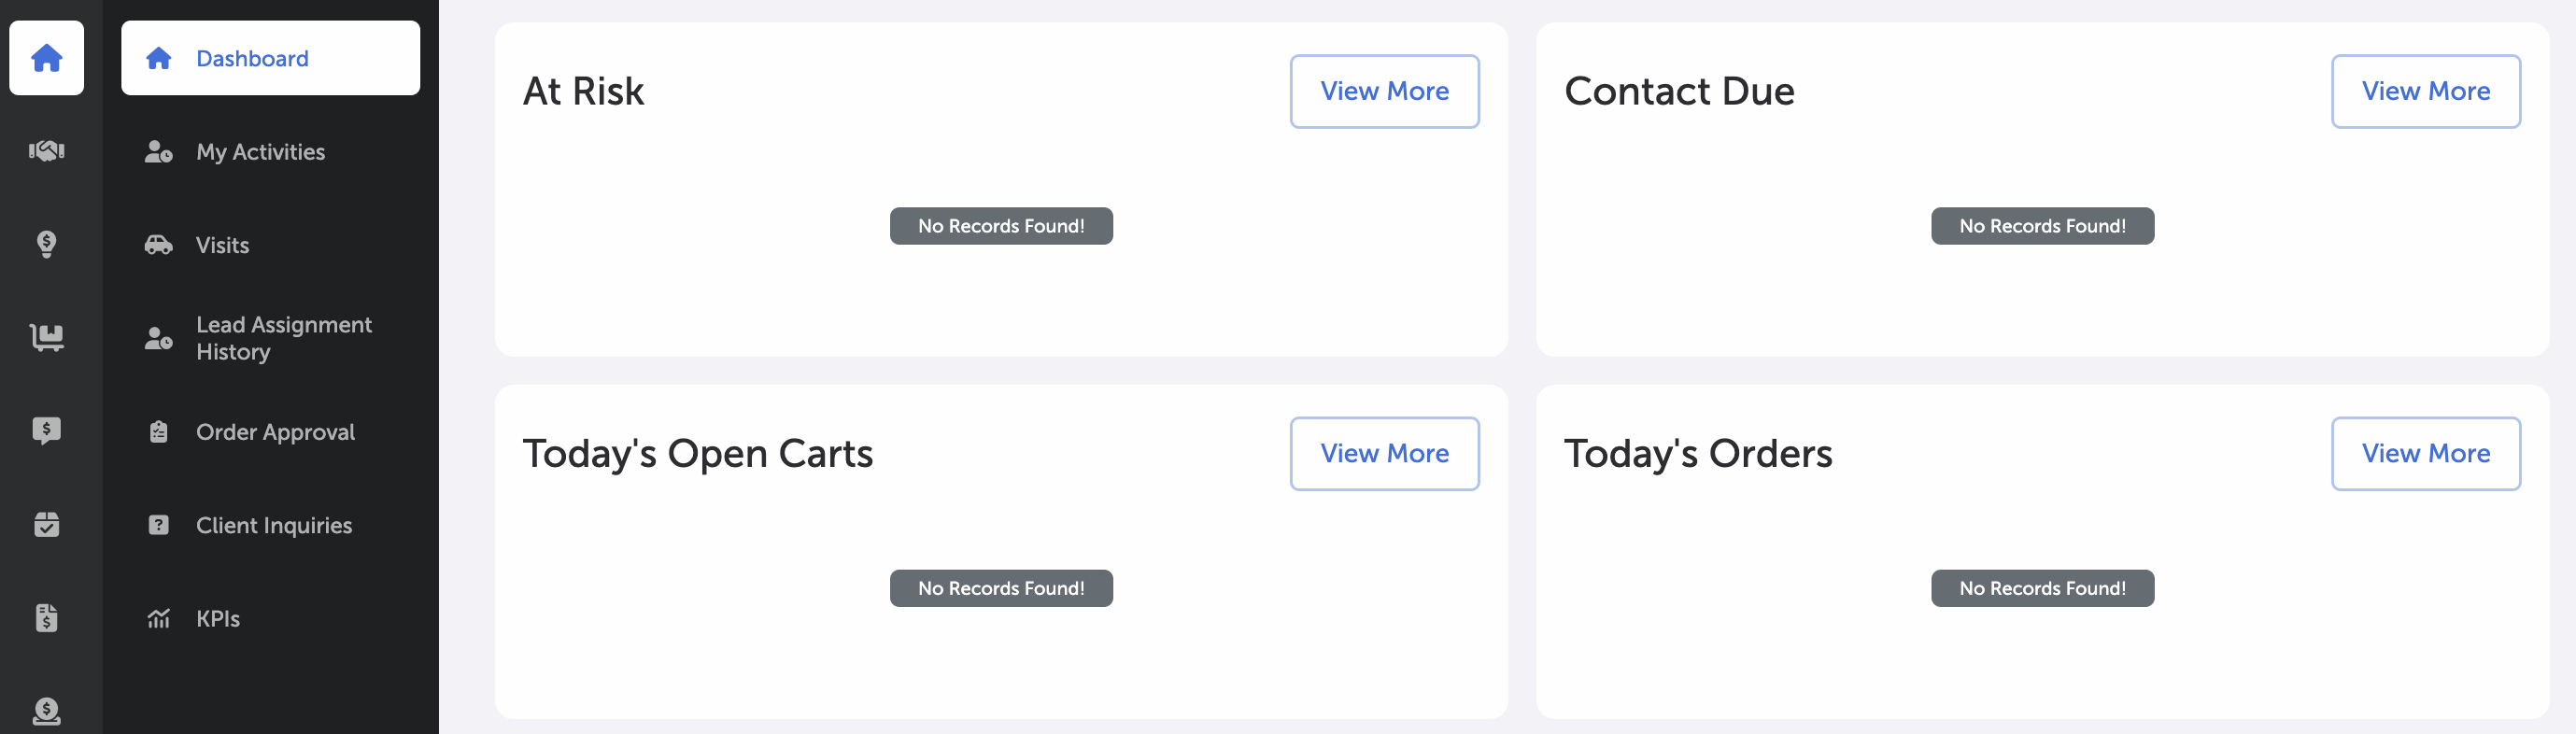
Dashboard - At Risk, Contact Due, Today's Open Carts, & Today's Orders
Today’s Calls (All users)
Todays's Calls displays your 5 most recent completed Calls and includes:
- Phone #, Direction
- Client, Contact Info
- Client Type, Lead/Customer, time
Selecting the View More button displays the Call History page with additional call information.
For additional information, please refer to Call History.
Today’s Invoices (All users)
This area lists the five most recent invoices for the day. The display includes:
- Order #, Status
- Client, Address
- Total dollar amount of order, Number of Lines
Selecting the View More button displays the Invoices page with additional invoice information.
For additional information, please refer to Invoices.
Client Inquiries (All users)
This area lists the most recent general inquiries or quote requests submitted through the E-Commerce portal and includes:
- Client Name
- Inquiry Type
- Date
Selecting the View More button displays the Client Inquiries page.
Today’s Quotes (All users)
Today's Quotes shows pending open client quotes. Your 5 most recent Quotes are displayed with the following:
- Order #, Status
- Client, Address
- Total dollar amount of order, Number of Lines
Selecting the View More button displays the Quotes page with additional quote information.
For additional information, please refer to Quotes.
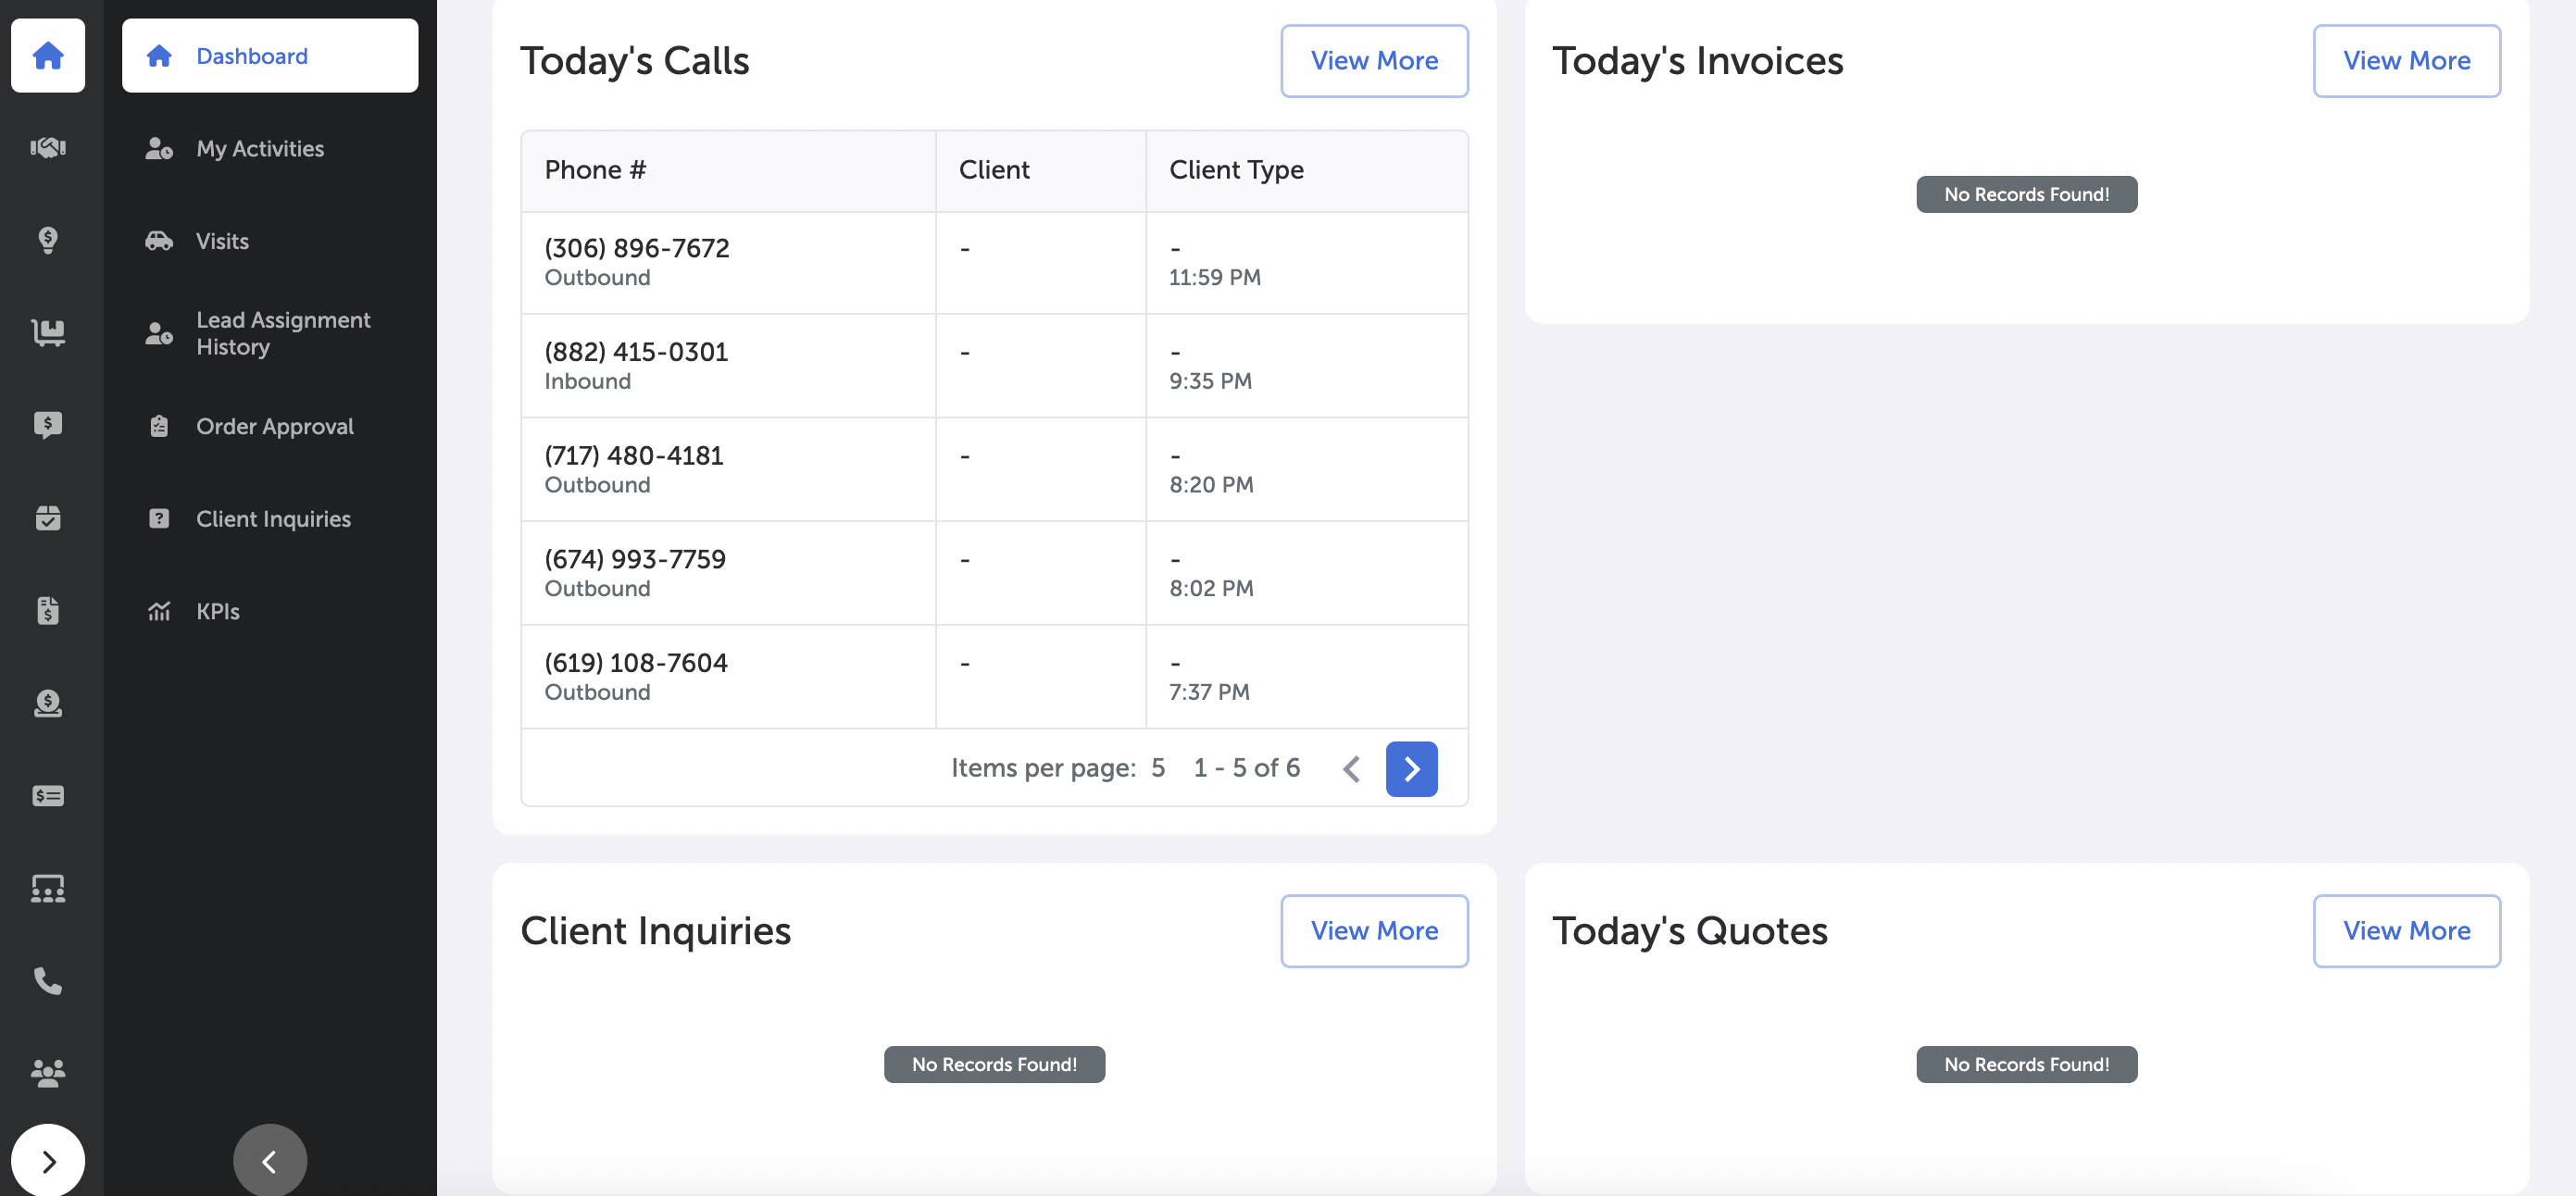
Dashboard - Today's Calls, Today's Invoices, Client Inquiries, & Today's Quotes
The Teams Tab is available to Sales Managers and Admins.
The Teams tab includes a multi-select dropdown to filter by Team.
Just like the User tab, the Teams tab displays KPIs and a graph with the same functionality but showing Team level data. Teams are delineated visually on the graph by different colors.
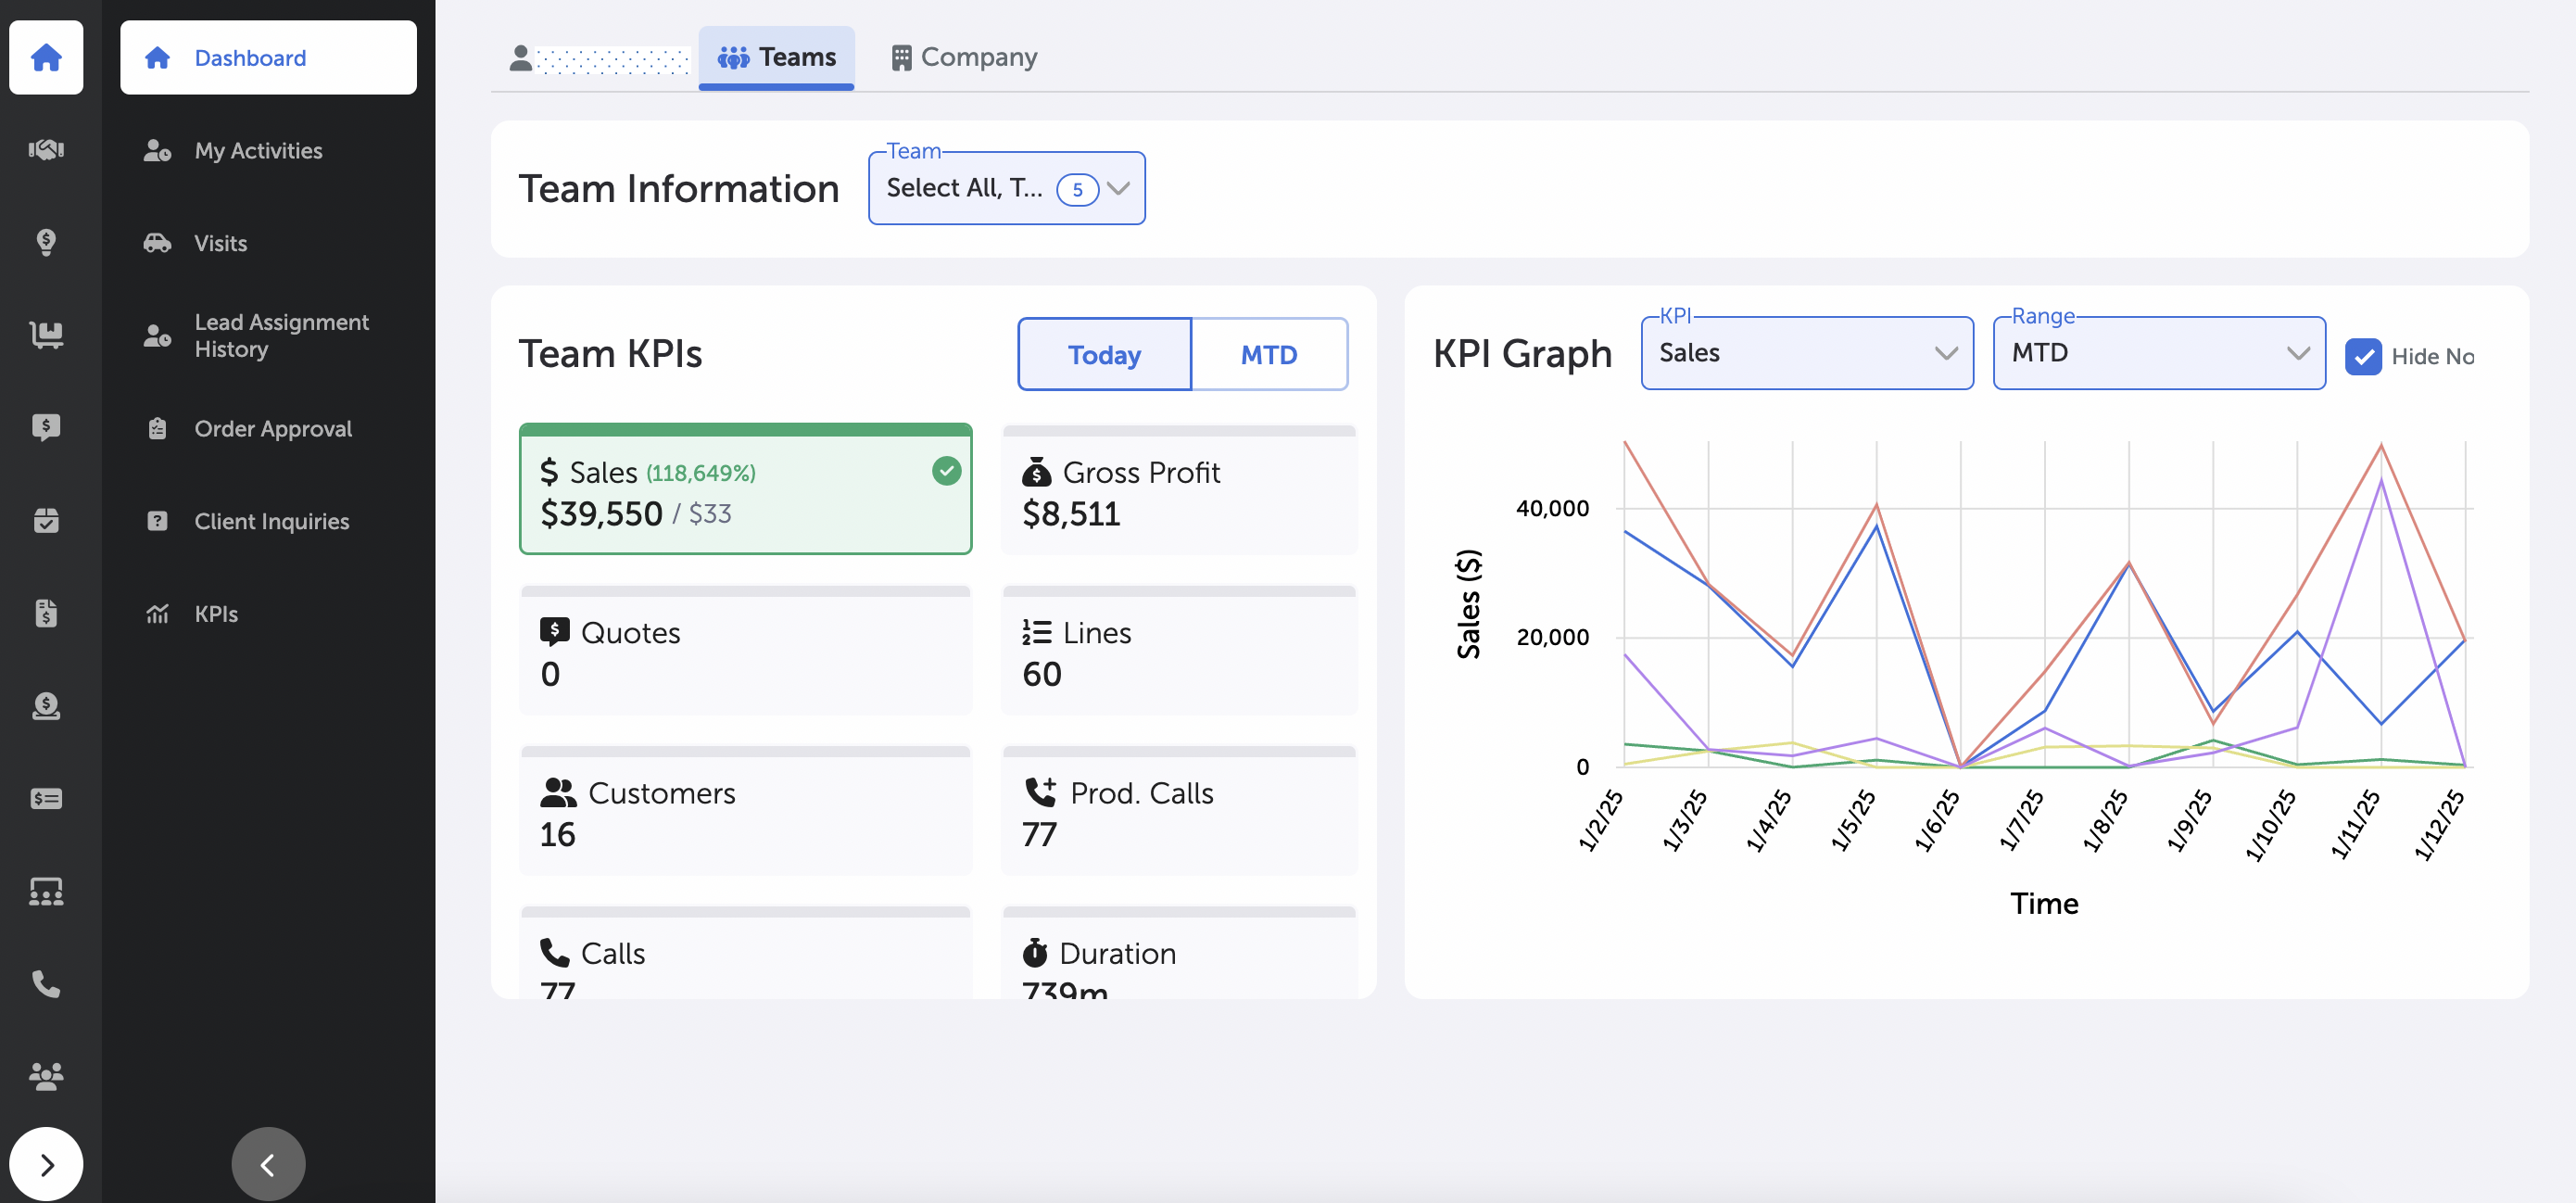
Dashboard - Team Tab
The Company Tab is available to Sales Managers and Admins.
The Company tab displays information relative to the whole organization, and just like the User and Team tabs, displays KPIs and a graph as well as the following:
- At Risk
- Contact Due
- Today's Open Carts
- Today's Orders
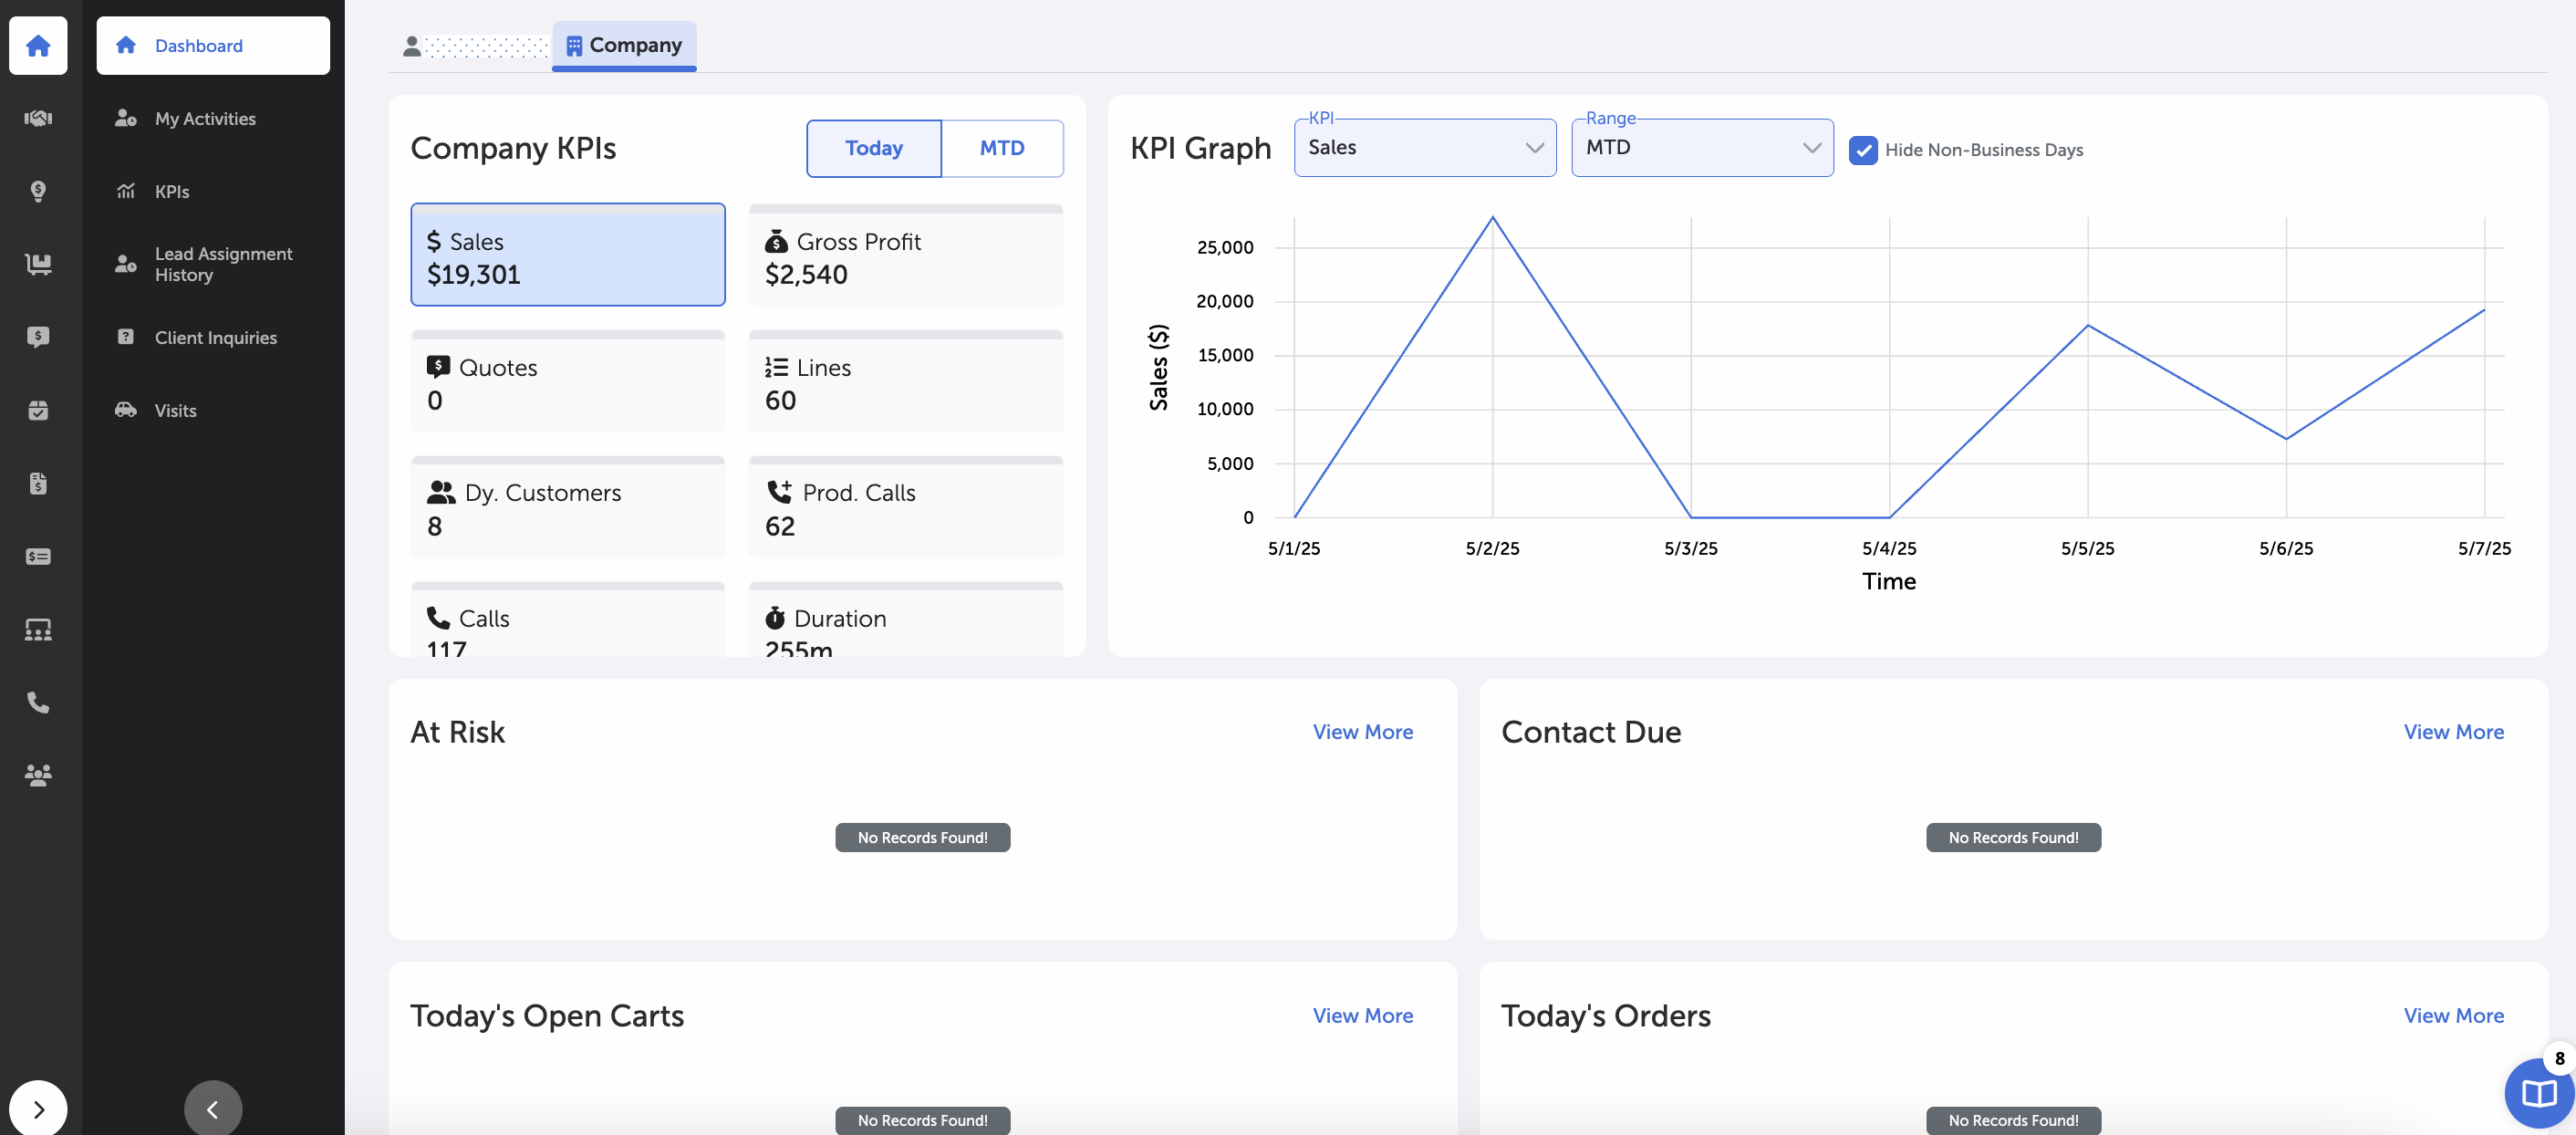
Dashboard - Company Tab
Updated 9 months ago