
KPIs
All roles have access to the KPIs page.
The KPIs page is similar to the Dashboard in that it displays My KPIs and a KPI Graph. However, it also displays a KPI Table that can be filtered by month.
My KPIs displays your current Key Performance Indicators. It serves as a snapshot of productivity. The performance view can be toggled to Today or MTD. The default view is Today and includes the following:
- Sales - The total revenue generated from sales
- Gross Profit - The total revenue minus the cost
- Quotes - The total number of quotes provided to customers
- Lines - The total number of product line items sold
- Customers - The total number of unique customers who purchased
- Productive Calls - The total number of calls made exceeding 35 seconds
- Calls - The total number of calls made
- Duration - The total time spent on customer calls, measured in minutes
- Lead Visits - The count of in-person visits to leads
- Customer Visits - The number of in-person visits to existing customers
- GP Margin - The percentage of gross profit relative to total revenue, indicating profitability
- Customers Closed - The number of new customers acquired
The MTD performance view includes all the information contained above as well as:
- Projected monthly values with percentages
- Average value per day
Monthly data calculations are based upon current Sales Rep performance and monthly goals.
The KPI Graph shows a visual representation of your performance and can be filtered by:
- KPI Type (dropdown; dynamic list that is based upon KPI configuration for Sales Rep)
- Range (dropdown):
- MTD
- Last Month
- QTD
- Last Quarter
- YTD
- Last Year
- Custom (when chosen, start and end date filters can be selected via More Filters button)
- More Filters (button):
- Hide Non-Business Days (checkbox) - for more information, please refer to Non-Business Days
- Start Date and End Date (filters appear when Custom Range type is chosen in Range dropdown)
Selecting different KPI types in the dropdown will update the graph to show the KPI's values over the chosen time period. Hovering over the graph will display data points with values corresponding to that date.
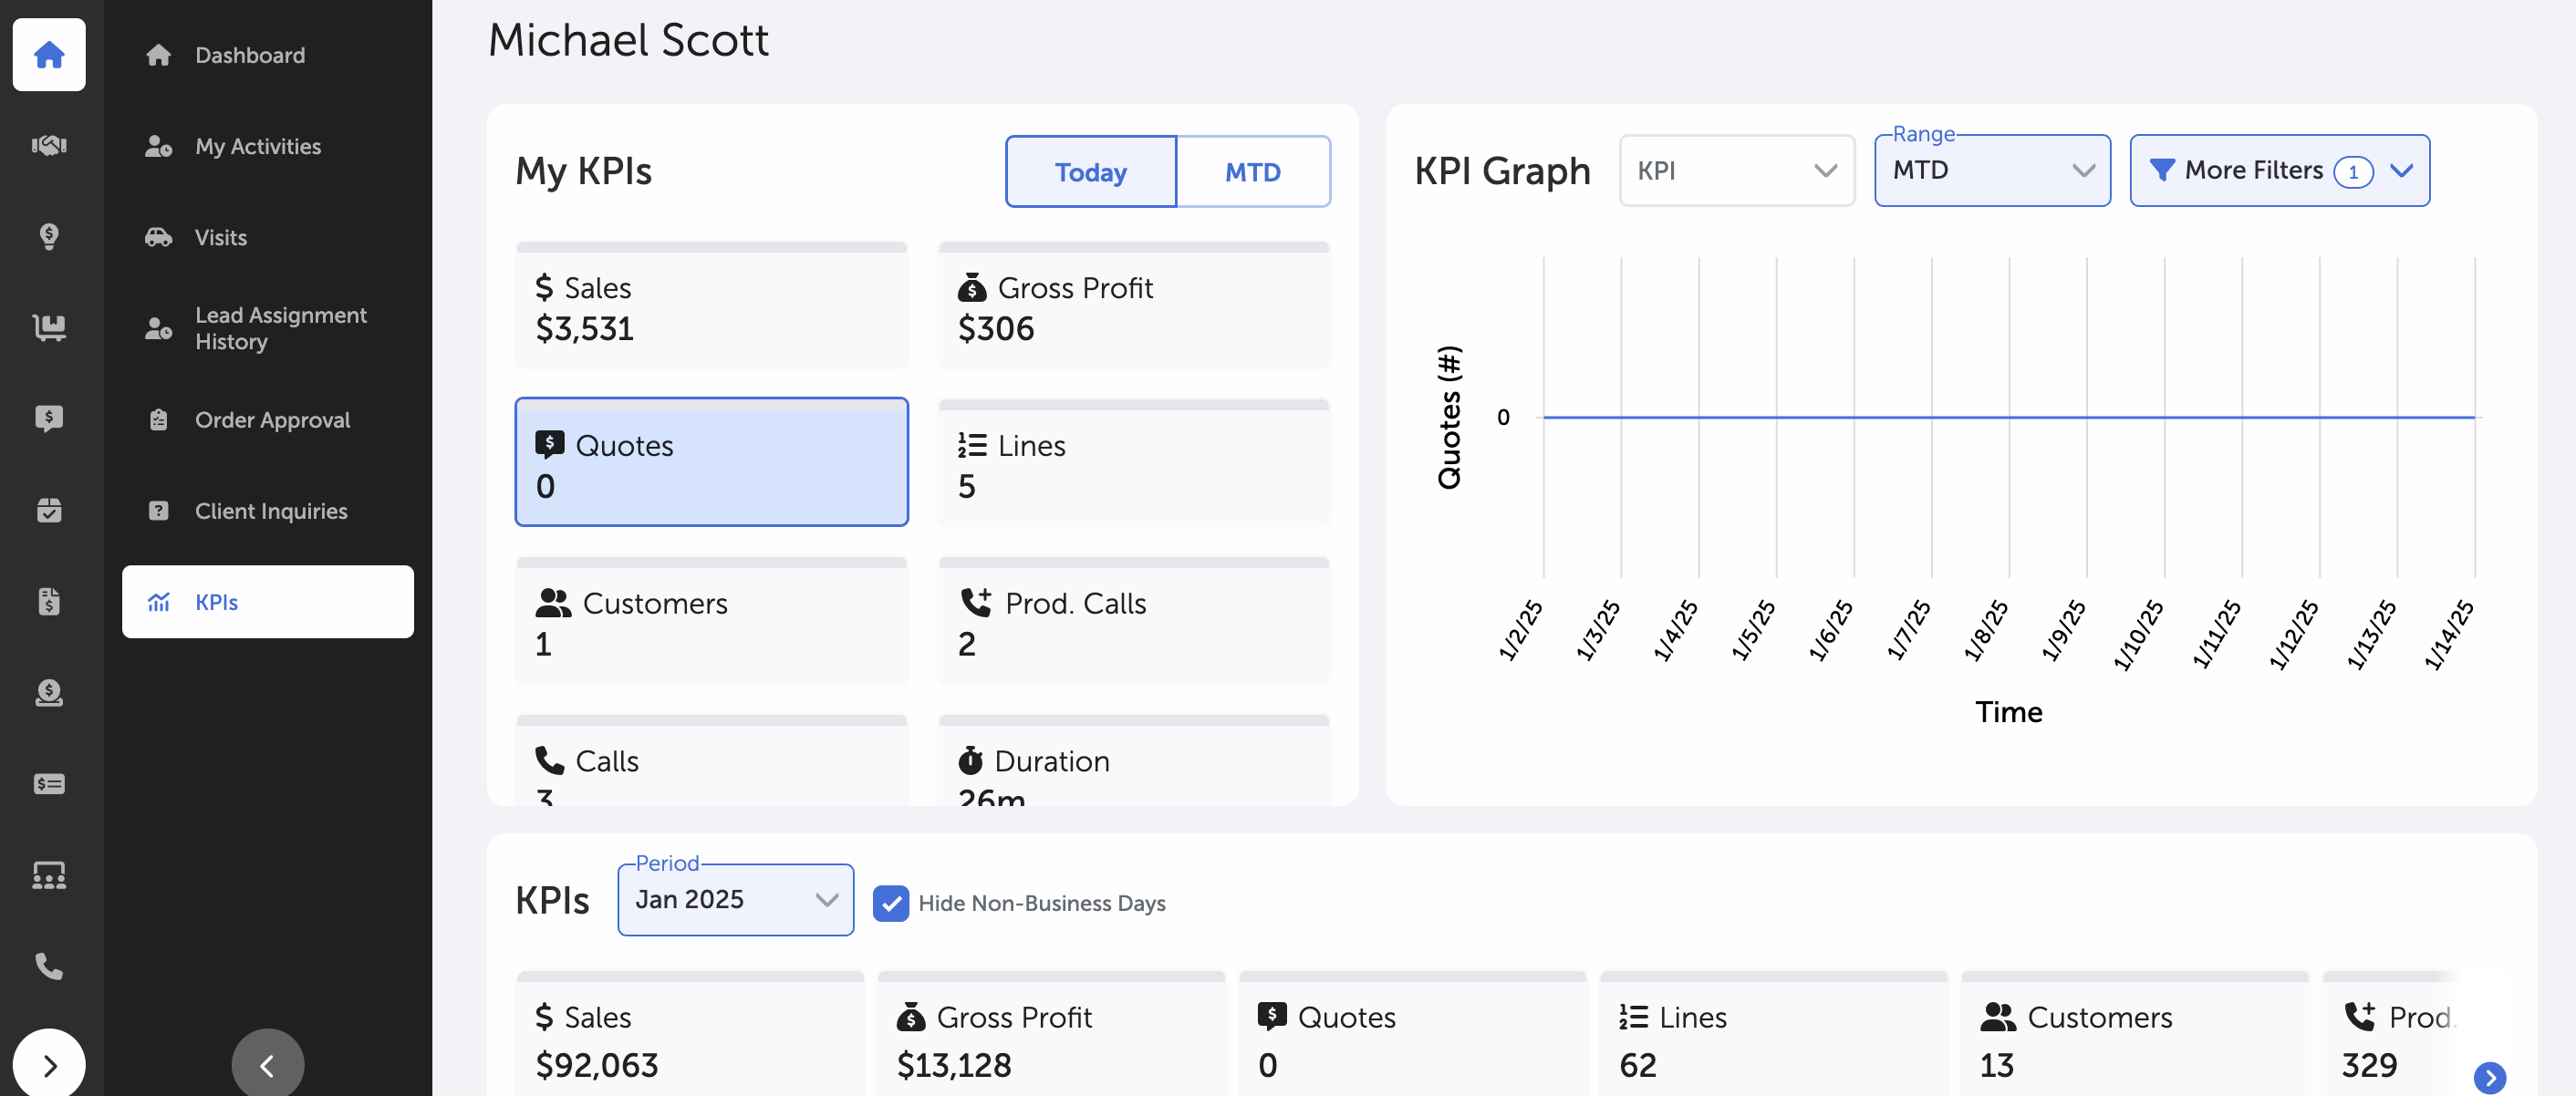
KPIs Page - My KPIs & KPI Graph
The KPIs Table displays a snapshot and daily performance data in many categories and can be filtered by Period (month).
A horizontal band displays a monthly snapshot of the KPI data in aggregate based upon Period filter selection and includes the following KPIs:
- Sales, Projected, Average Per Day (in dollars)
- Gross Profit, Projected, Average Per Day (in dollars)
- Quotes, Projected, Average Per Day
- Lines, Projected, Average Per Day
- Customers, Projected, Average Per Day
- Prod. Calls, Projected, Average Per Day
- Calls, Projected, Average Per Day
- Duration (minutes), Projected (minutes), Average Per Day
- Lead Visits, Projected, Average Per Day
- Customer Visits, Projected, Average Per Day
- GP Margin (%), Projected, Average % Per Invoice
- Customers Closed, Projected, Average Per Day
Projected data in KPIs Table will only show when filtered by current month or future month.
Underneath the snapshot, a Daily breakdown of your monthly performance is displayed. You can filter the dropdown to select the current month or any of the previous 12 months. The default view is the current month. A checkbox can be selected to Hide Non-Business Days. Information is sorted by date from new to old.
Daily category information includes:
- Date, day of the week
- Sales (dollars), Goal (dollars), Percentage Met
- Gross Profit (dollars), Goal (dollars), Percentage Met
- GP Margin (%), Goal (%), Percentage Met
- Quotes, Goal, Percentage Met
- Daily Customers, Goal, Percentage Met
- Lines, Goal, Percentage Met
- Productive Calls, Goal, Percentage Met
- Calls, Goal, Percentage Met
- Duration (minutes), Goal (minutes), Percentage Met
- Lead Visits, Goal, Percentage Met
- Customer Visits, Goal, Percentage Met
- Customers Closed, Goal, Percentage Met
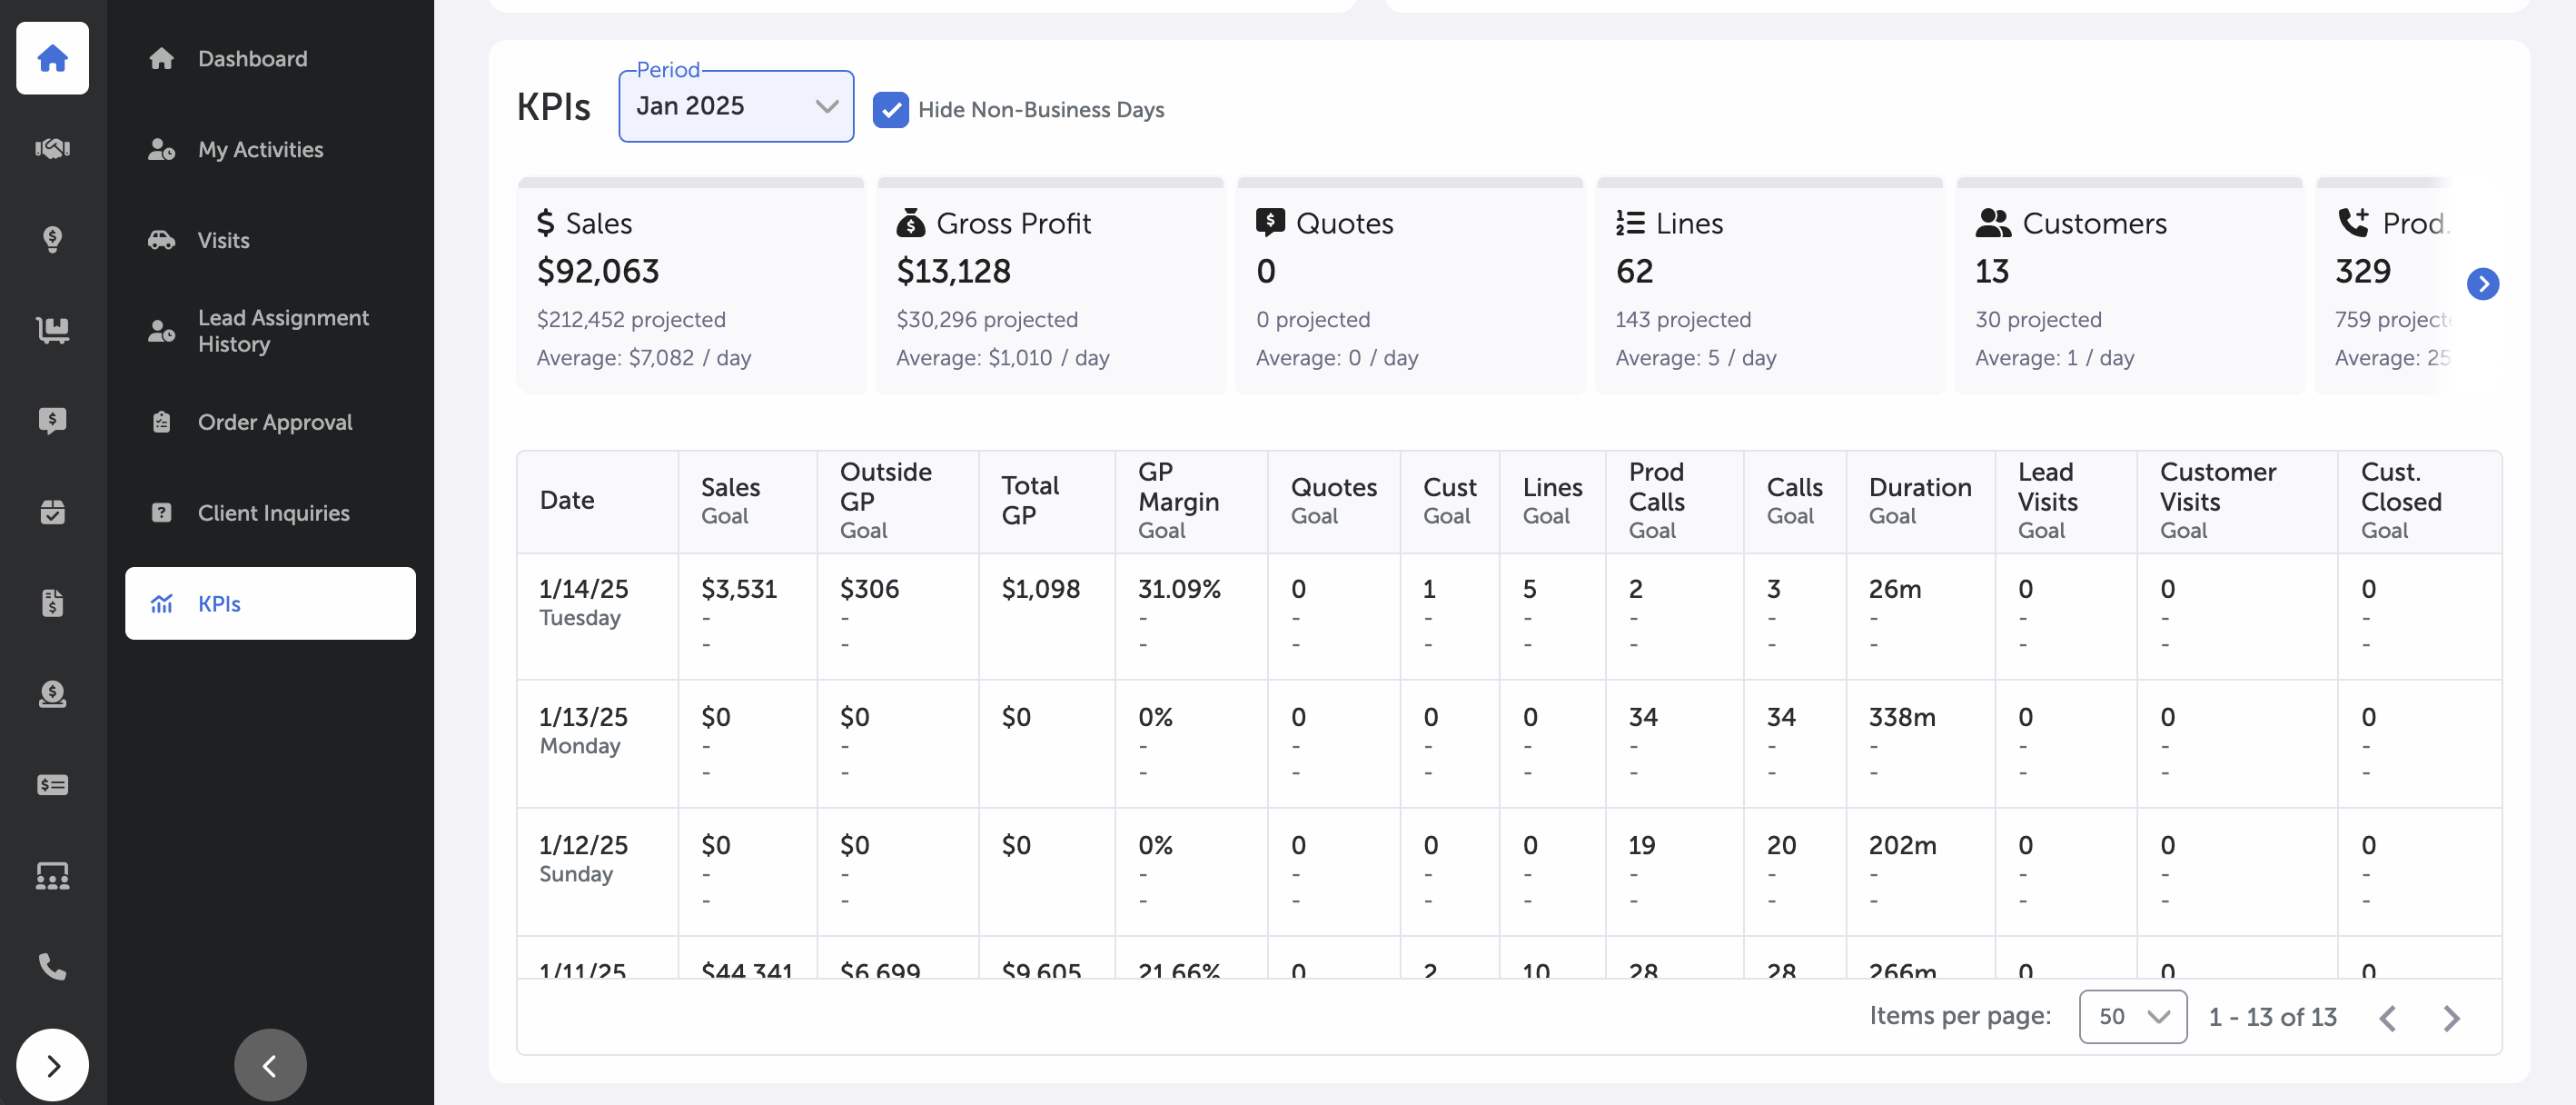
KPIs Page - KPIs Table
Main Page -- Dashboard
Updated 10 months ago